
- Pain points in measuring an AI project
- Introduction of the AI Project Balanced Scorecard
- 1: Business Value & ROI
- Why we should measure business value&ROI?
- What to measure about business value&ROI?
- 2: User Adoption & Satisfaction
- Why we should measure User Adoption & Satisfaction
- What to measure about User Adoption & Satisfaction
- 3: AI Performance & Reliability
- Why we measure AI Performance and Reliability?
- What to measure about AI Performance and Reliability?
- 4: Trust, Risk & Compliance
- Why we measure Trust, Risk & Compliance?
- What to measure about Trust, Risk & Compliance?
- Real Life Example
Pain points in measuring an AI project
Teams like software development, R&D, or digital transformation centers have long wrestled with a tricky problem: performance measurement. For most companies, technology and digital tools are seen as enablers of efficiency, not as revenue drivers directly tied to the business. That makes success hard to pin down.
Take software development teams, for example. Their success metrics are often a mix of hard numbers—like release frequency, on-time delivery, cost, and quality—and softer measures, such as user feedback or perceived performance improvements. But the reality often feels murky. Leaders end up saying things like: “It’s expensive, but we have to do it because everyone else is,” or “This tech is supposed to boost efficiency, but users keep complaining—it seems valuable in some ways, yet it also creates new headaches.” At the end of the day, is it truly profitable? Nobody can say for sure. That’s why I wrote a whole book called <Agile Team performance management> to explore the solutions.
Now it’s AI’s turn to shoulder those same big expectations of entrepreneurs—helping organizations become leaner, more efficient, and more profitable. Many companies are spinning up internal AI teams or bringing in third parties to build custom solutions.
But the same old question resurfaces: how do you measure success? CEOs find themselves staring at AI budgets with the same question they once had about digital transformation investments – how to measure the success?
And here’s the thing—getting this right matters more than ever. AI isn’t just another efficiency tool; it has the potential to reshape how companies operate and compete. But without clear, meaningful ways to measure its impact, organizations risk repeating the same cycle: high hopes, heavy spending, and lots of uncertainty.
Introduction of the AI Project Balanced Scorecard
If you’re adopting AI or building your own AI agents inside a company to solve some issues or improve the efficiency, the success isn’t measured by “did we ship it” but by whether it meaningfully improved how the business operates.
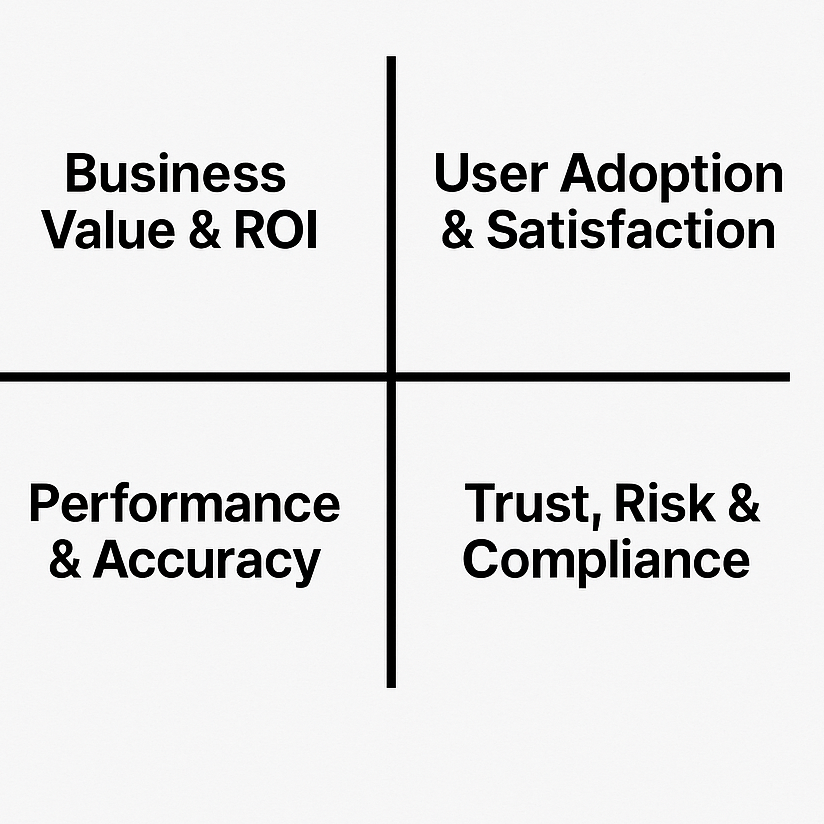
About what to measure and how to measure, leverage from my old research with Agile teams in software industry , I’d break it down into four measurement dimensions, which I call it AI Project Balance Score Card. It contains 4 dimensions. Here is how it looks like:
The balanced scorecard can be applied to both AI adoption projects and AI development projects—but the emphasis shifts a little depending on the context:
In AI Adoption Projects, this score card can help to measure and prove whether the AI is valuable in practice.
In AI Development Projects, this score card can help to make sure development progress stays tied to business goals and safe usage, not just technical accuracy.
Let’s dive into the details.
1: Business Value & ROI
Why we should measure business value&ROI?
AI adoption often starts as a “cool tech experiment.” Without hard business outcomes, it becomes a cost center, not a growth driver.
Executives will ask: “Did this AI save us money, make us money, or let us do things faster/cheaper?” If you can’t prove ROI, scaling will stall.
It also filters out “AI theater” — projects that look impressive but don’t move the needle.
What to measure about business value&ROI?
When reporting Business Value & ROI of AI projects, don’t limit to dollars saved/earned. Consider Growth & Revenue,Efficiency, Capacity&Scalability , Organizational Impact — all of which can be quantified and tied back to ROI.
Here is a detailed indicators check list and examples you can refer to:
Growth & Revenue Examples
| Metric | What It Measures | Example |
| Conversion uplift | Increased sales from better targeting | AI-driven personalization lifts online conversion rate 3% → 4.5% |
| Customer lifetime value (CLV) | Increased retention/upsell | AI recommendations increase average CLV by 12% |
| Cross-sell / upsell revenue | Revenue from additional purchases | AI agent suggests accessories → +$1M annual revenue |
| Market expansion | New markets/products enabled by AI | AI translation/localization enables entry into 2 new countries |
| Cost savings | Direct reduction in expenses | AI chatbot handles 30% of queries → avoids hiring 5 new support staff |
Efficiency Examples
| Metric | What It Measures | Example |
| Productivity gain | Output per employee | Analysts process 60% more compliance cases with AI assistant |
| Cycle time reduction | Process speed | Contract review reduced from 5 days → 2 days |
| Error reduction savings | Money saved from fewer mistakes | Fewer billing errors saves $50k in rework costs |
| Quality improvements | Accuracy & trust | AI QA system reduces defect rate by 30% |
Capacity& Scalability Examples
| Metric | What It Measures | Example |
| Volume handled per employee | How much one worker can do with AI | Support rep handles 2x more tickets with AI triage |
| 24/7 availability | Always-on coverage | AI assistant provides instant response outside office hours |
| Geographic reach | Expansion potential | AI localization reduces entry cost for foreign markets |
Organizational Impact Examples
| Metric | What It Measures | Example |
| Employee hours reclaimed | Time freed for higher-value work | AI takes over 10k hours/year of repetitive data entry |
| Employee engagement | Job satisfaction improvement | Employees report 20% higher engagement after workload reduced |
| Attrition reduction | Lower turnover | Stressful manual work replaced by AI → attrition drops by 10% |
| Decision cycle time | Time taken to make critical business decisions. | Reduced product pricing approval cycle from 10 days to 3 days. |
When you measure ROI, you learn which AI use cases are worth doubling down on, and which are distractions.
2: User Adoption & Satisfaction
Why we should measure User Adoption & Satisfaction
AI that isn’t used = zero value, no matter how accurate or “state of the art.” Adoption is critical — an AI agent unused (or resented) is just shelfware, no matter how “smart” it looks on paper.
Employees or customers often resist change. Measuring adoption tells you if the AI is becoming a natural part of daily work or if people are bypassing it.
Satisfaction helps you catch early friction (e.g., “This bot wastes time” or “I don’t trust its answers”) before it become a big issue.
What to measure about User Adoption & Satisfaction
Measuring adoption & satisfaction isn’t just about “did they log in.” or “how long did they take”, “how many tokens did they use”. It’s about:
- Behavior (how often, how deep, how spread)
- Perception (do they like it, trust it, and recommend it)
- Change impact (does it replace old habits, dose it stick in workflows).
Here are some metrics that may reflect the real user adoption and satisfaction:
Adoption Metrics (Behavioral)
| Metric | What It Measures | Example Target |
| Onboarding completion | % of users who try the AI after launch | ≥80% of target users |
| Activation rate | % of users doing a meaningful action | ≥60% perform 3+ queries |
| Feature usage distribution | Breadth of AI feature use | ≥50% of features used within 3 months |
| Depth of use | Avg. interactions per session | ≥5 per session |
| Coverage | % of processes/tasks routed via AI | 60% of expense claims use AI |
| Voluntary vs forced use | Self-driven adoption | ≥70% voluntary use |
Satisfaction Metrics (Perceptional)
| Metric | What It Measures | Example Target |
| User Satisfaction Score (USS) | Quick 1–5 rating | ≥4.2/5 |
| Net Promoter Score (NPS) | Likelihood to recommend | ≥30 |
| Confidence/Trust rating | % of users trusting AI output | ≥70% |
| Perceived value | Users feel job is easier/faster | ≥75% positive |
| Frustration index | % of unhelpful/redo cases | ≤10% |
Change Management Metrics
| Metric | What It Measures | Example Target |
| Adoption velocity | Time to steady-state usage | ≤3 months |
| Drop-off rate | % of one-time users | ≤20% |
| Substitution rate | Old tools/processes replaced | ≥50% reduction in old tickets |
| Cross-team penetration | Adoption across departments | 3+ teams in 6 months |
Workflow Integration Indicators
| Metric | What It Measures | Example Target |
| Task completion time | Faster task execution | 20% faster vs baseline |
| Switching friction | How often users revert | ≤15% |
| Error recovery rate | AI helps correct mistakes | ≥80% |
| Collaboration enablement | Effect on teamwork | Positive rating ≥4/5 |
Here are few tips when you measure the user adoption and satisfaction. Pick 2–3 indicators per category depending on your project, but do cover both behavior (usage data) and perception (survey data) in order to get a full picture. And when you trick workflow integration indicators, compare against baseline processes to prove adoption is meaningful, not superficial.
3: AI Performance & Reliability
Why we measure AI Performance and Reliability?
When people think about AI, leaders naturally focus on ROI, but for end users, what matters most is accuracy and consistency. An AI that’s right 90% of the time but fails in unpredictable ways can actually cause more harm than good, because once trust is broken, adoption stalls. That’s why measuring performance is about finding the right balance between ambition and reality. Even if the system can’t handle every scenario, being able to reliably solve 70% of cases is already a meaningful win. Metrics like task success rate show how often the AI gets things right without needing human correction, while error rate highlights whether mistakes are rare, recoverable, and ultimately cheaper to fix than the old manual way. And consistency matters just as much—users need to know whether the AI will deliver steady, predictable results rather than behaving erratically.
What to measure about AI Performance and Reliability?
Here’s are few metrics categories and examples you can refer to when you create a structured AI Performance & Reliability Indicator checklist for your organization, to cover more than just “accuracy.”
Accuracy & Task Success
| Metric | What It Measures | Example Target |
| Precision / Recall / F1 | Accuracy of classification/detection | ≥0.85 F1 score |
| Top-N accuracy | % correct answer in top N suggestions | ≥90% in top-3 |
| Intent recognition accuracy | Chatbot understanding of user input | ≥85% correct intents |
| Task completion rate | % tasks fully resolved without human | ≥80% |
Consistency & Stability
| Metric | What It Measures | Example Target |
| Output variance | Consistency of responses to same input | <5% variance |
| Repeatability under load | Reliability with multiple users | 95% success under peak load |
| Version drift | Stability after model updates | ≤2% change in accuracy |
AI Efficiency
| Metric | What It Measures | Example Target |
| Latency | Avg. response time | <2 seconds |
| Throughput | Requests handled per unit time | ≥100 req/sec |
| Scalability | Performance under 10x growth | Stable with <10% slowdown |
| Resource efficiency | Cost per inference / API call | ≤$0.01 per call |
Robustness
| Metric | What It Measures | Example Target |
| Graceful degradation | Ability to fail safely | 100% fallback to human when needed |
| Failure rate | % unusable/erroneous outputs | ≤3% |
| Out-of-scope handling | AI admits “I don’t know” | ≥90% correct declines |
| Edge case coverage | Rare but critical scenarios handled | ≥85% |
Learning & Adaptability
| Metric | What It Measures | Example Target |
| Continuous improvement | Gains per retrain cycle | +3–5% accuracy each retrain |
| Feedback incorporation | % user corrections applied | ≥70% |
| Domain adaptation speed | Time to adapt to changes | <4 weeks |
Explainability & Transparency
| Metric | What It Measures | Example Target |
| Explainability success | % outputs with rationale | ≥80% |
| Auditability | Decision trail reconstructable | 100% logged |
| Consistency of Explanations | Whether similar inputs produce similar explanations (avoids randomness in rationale) | ≥90% alignment |
Tracking reliability isn’t just about numbers—it pushes you to design graceful failure modes, like escalating to a human when the AI struggles. That safety net builds trust and makes adoption easier. The key is to focus on a small set of metrics, usually three to four that match the specific use case, whether it’s a chatbot, document analysis, or fraud detection. Before launch, establish both a baseline and clear target thresholds so you know what success looks like. Then, continue tracking over time to demonstrate reliability, strengthen user confidence, and provide evidence for scaling the solution further.
4: Trust, Risk & Compliance
Why we measure Trust, Risk & Compliance?
When adopting AI, measuring trust, risk, and compliance is critical because even the most advanced system can fail if it sparks legal challenges, reputational damage, or regulatory backlash. Many AI projects die not from poor performance, but from a lack of governance and oversight. Trust and transparency are more than ethical ideals—they directly shape adoption. Employees, customers, and regulators will not embrace or approve a system they don’t understand or believe is fair. Without building this foundation of trust, even a technically powerful model risks rejection and eventual collapse.
What to measure about Trust, Risk & Compliance?
When it comes to trust, risk, and compliance, the key is to measure whether the AI is operating in a way that’s transparent, safe, and fair. Transparency means users can clearly understand why the AI gave its answer or recommendation, rather than feeling it’s a “black box.” Risk mitigation focuses on whether sensitive data is protected and outputs stay compliant with industry and legal regulations. Equally important is monitoring bias and fairness to ensure the AI behaves consistently across different groups. Without these safeguards, AI can silently create risks—like data leaks, biased outputs, or regulatory violations—that undermine the entire business.
Below are some categories of metrics that you can use to evaluate the Trust, Risk & Compliance status for AI projects:
Data Protection & Security
| Metric | What It Measures | Example |
| Data leakage rate | % of outputs that expose sensitive info | No customer PII appears in AI responses |
| Access control compliance | Whether AI respects role-based permissions | HR bot only shows salary data to HR staff |
| Audit trail completeness | % of interactions logged for review | 100% of queries stored with metadata |
| Encryption compliance | Alignment with company security standards | All stored data uses AES-256 encryption |
Regulatory & Legal Compliance
| Metric | What It Measures | Example |
| Regulatory alignment | Adherence to GDPR, HIPAA, PCI, etc. | Healthcare AI redacts PHI per HIPAA rules |
| Right-to-explanation | Ability to explain decisions | 90% of credit score outputs include rationale |
| Retention compliance | Data lifecycle control | Logs auto-deleted after 90 days |
| Third-party compliance | Vendor/legal obligations | External LLM meets contractual security standards |
Fairness & Bias
| Metric | What It Measures | Example |
| Demographic parity | Equal performance across groups | Loan approval AI shows <2% variance by gender |
| Outcome equity | Fairness of outputs | Promotion recommendations balanced across age groups |
| Bias detection coverage | % of bias scenarios tested | Quarterly audits cover gender, age, region |
| Mitigation success rate | Bias issues resolved on time | 95% of flagged bias cases fixed within 30 days |
User Trust & Transparency
| Metric | What It Measures | Example |
| Confidence alignment | Match between AI confidence and correctness | AI says “low confidence” only when accuracy <60% |
User trust rating | Employee/customer trust perception | 4.2/5 average “I trust this output” rating |
Transparency index | Outputs with rationale/citations | 85% of chatbot answers include source links |
Escalation clarity | User awareness of fallback | 95% of users know when to escalate to a human |
Risk & Incident Management
| Metric | What It Measures | Example |
| Error criticality rate | % of errors causing material risk | Only 0.5% of errors trigger compliance escalation |
| Incident response time | Time to detect and fix issues | 24h SLA for AI-related incidents |
| Hallucination frequency | Rate of confident but false answers | <3% of answers contain hallucinations |
Adversarial robustness | Resistance to attacks | No successful prompt injection in quarterly tests |
Ethical & Social Responsibility
| Metric | What It Measures | Example |
| Environmental cost | Energy per AI request | Model optimized to reduce CO₂ footprint by 15% |
| Human-in-the-loop coverage | % of high-risk tasks reviewed | 100% of medical recommendations verified by doctor |
| Value alignment | Consistency with brand/ethics | AI avoids toxic or discriminatory language |
When measuring trust, risk, and compliance in an AI project, teams could pick the three to five indicators most relevant to their domain—whether that’s finance, healthcare, HR, or another field. This focused approach keeps the process practical and meaningful. More importantly, the act of measuring trust itself drives better design choices: it pushes teams to make AI explainable and auditable, which in turn makes troubleshooting smoother and scaling far less risky.
When it comes to measurement, it’s easy to feel overwhelmed. There are countless angles, endless indicators, and the effort of gathering all the data can seem daunting. In practice, many teams end up cherry-picking a few convenient measures and customizing their own version of success. For most projects that might be fine—but for AI adoption, I strongly advise against it. The four areas in this scorecard—Business Value, User Adoption, AI Performance, and Trust & Compliance—aren’t optional. They are the four pillars that decide whether AI adoption thrives or collapses.
Think about it: if you only measure performance, you may build a “smart” system that nobody actually uses. If you only measure adoption, people might happily use a system that’s dangerously inaccurate. If you only measure ROI, you risk overlooking hidden trust issues that later explode into reputational or regulatory crises. And if you only measure compliance, you might stay safe but deliver no real business value.
By combining all four, you get a genuinely balanced scorecard. The C-suite can see ROI. Employees feel supported by a tool they trust. Engineers have clear performance metrics to improve. And risk or legal teams see the compliance checks they require. This balance is what turns AI from an isolated experiment into a sustainable capability that can scale across the entire organization.
Example
- Project name: ClearClaim AI
- Objective: Using AI to improve the efficiency of an existing customer service– Insurance claims processing
- Where AI tool helps(offered by vendor):
- Auto-triage incoming claims, extract key fields from forms/photos, flag probable fraud, draft claimant emails, and assist adjusters with next-best actions.
- Key collaborators in the process: Contact-center agents, claim intake ops, adjusters, fraud analysts, compliance, IT/ML platform, security.
- CEO’s expectation of AI adoption: Improve the efficiency, lower down the cost, improve customer satisfaction.
AI adoption Balanced Scorecard for “ClearClaim AI” project:
1) Business Value & ROI
| Metric | Definition / Calc | Baseline | Target (Q2 after launch) |
| Cycle time reduction | Avg days from FNOL→settlement | 10 d | 6 d |
| Cost per claim | (Total claim ops cost ÷ #claims) | $112 | $90 |
| Error-reduction savings | $ rework avoided from fewer data/decision errors | $0 | $150k/qtr |
| Volume handled per employee | Closed claims per adjuster per week | 25 | 35 |
| Employee hours reclaimed | Hours of repetitive work automated | 0 | +2,500 hrs/qtr |
*Benefit of this set: Mixes speed, cost, quality, capacity, and org impact so ROI isn’t just “savings” but also throughput and rework avoided—exactly as your article advises.
2) User Adoption & Satisfaction
| Metric | Definition / Calc | Baseline | Target |
| Onboarding completion | % adjusters/agents who try AI in first 30 days | 0% | ≥80% |
| Activation rate | % who perform 3+ AI tasks in week 1 | 0% | ≥60% |
| Coverage | % intake tasks routed via AI | 0% | ≥60% |
| Depth of use | Avg AI interactions per session | — | ≥5 |
| User Satisfaction Score (USS) | 1–5 post-task rating | — | ≥4.2/5 |
| Drop-off rate | % one-time users (30-day window) | — | ≤20% |
*Benefit of this set: Covers behavior + perception + change so you can tell if AI is truly embedded, not forced shelfware.
3) AI Performance & Reliability
| Metric | Definition / Calc | Baseline | Target |
| Task completion rate | % claims auto-triaged/extracted correctly w/o human fix | 0% | ≥80% |
| Extraction F1 | F1 on key fields (policy #, loss date, amount, cause) | 0% | ≥0.85 |
| Latency | Avg response time for triage/extraction | — | <2s |
| Failure rate | % unusable outputs triggering manual redo | — | ≤3% |
| Out-of-scope handling | % times AI correctly declines/defers | — | ≥90% |
| Graceful degradation | 100% human fallback when confidence low | Policy | Met |
*Benefit of this set: Balances accuracy, speed, safety; focuses on predictable, explainable behavior and reliable fallbacks that sustain adoption.
4) Trust, Risk & Compliance
| Metric | Definition / Calc | Baseline | Target |
| Data leakage rate | % outputs exposing PII/PHI | 0% | 0 incidents |
| Access-control compliance | RBAC respected for salary/medical/claim data | 0% | 100% pass |
| Audit trail completeness | % interactions fully logged w/ metadata | — | 100% |
| Regulatory alignment | GDPR/PCI/insurance regs applied (redaction, retention) | — | 100% controls green |
| Hallucination frequency | % confident but false answers in claimant comms | — | <3% |
| Incident response time | Detect→fix SLA for AI issues | — | ≤24h |
*Benefit of this set: Proves the system is safe, auditable, and fair, de-risking scale-up and keeping legal/compliance on side.
How to run this scorecard:
1: Baseline first, then targets. Capture pre-AI cycle time, cost per claim, error rates, and adoption baselines in a 2–4-week window.
2: Report monthly; review quarterly. Share a one-page KPI sheet with trends and a short “so what / now what” for the exec team and ops leads.
You may wonder why set a target. in an AI project, the purpose of setting a target is to show whether the AI is actually delivering value compared to the “old way” of doing things. Think of it as a testable hypothesis:
- Before AI: claims took 10 days to close.
- Target after AI: should bring it down to 6 days otherwise it’s not worth investing.
If the system hits (or gets close to) the target, you have evidence that the AI is not just a shiny tool but a valuable business enabler.


Leave a comment